I love https://grid.iamkate.com/ - it is a website that I lurk on a lot!
The UK is transitioning rapidly to a green energy future and Kate's website is visited often by people in my company (and may other people across the internet) to get a look at what is happening.
At the same time I have been on an odyssey building lots and lots of little bits of my own software, and I particularly love building CLI based tools.
So I figured if I want to visualise this data regularly without opening a browser, can I make a little CLI tool to do it for me? Particularly - can I just get a snap shot of the current energy mix?
Turns out it was very easy!
The API is provided by the NESO carbon intensity API - a free API directly from the UK's national grid. This is one of the APIs that Kate's website uses to provide data (her site does way more though, so if you want more insight, use her website).
Then I just used the rich python library to visualise it.
How to use it
If you are using uv then you already have uvx installed, so you don't need a separate install step.
Just run:
shelluvx gbeng mix
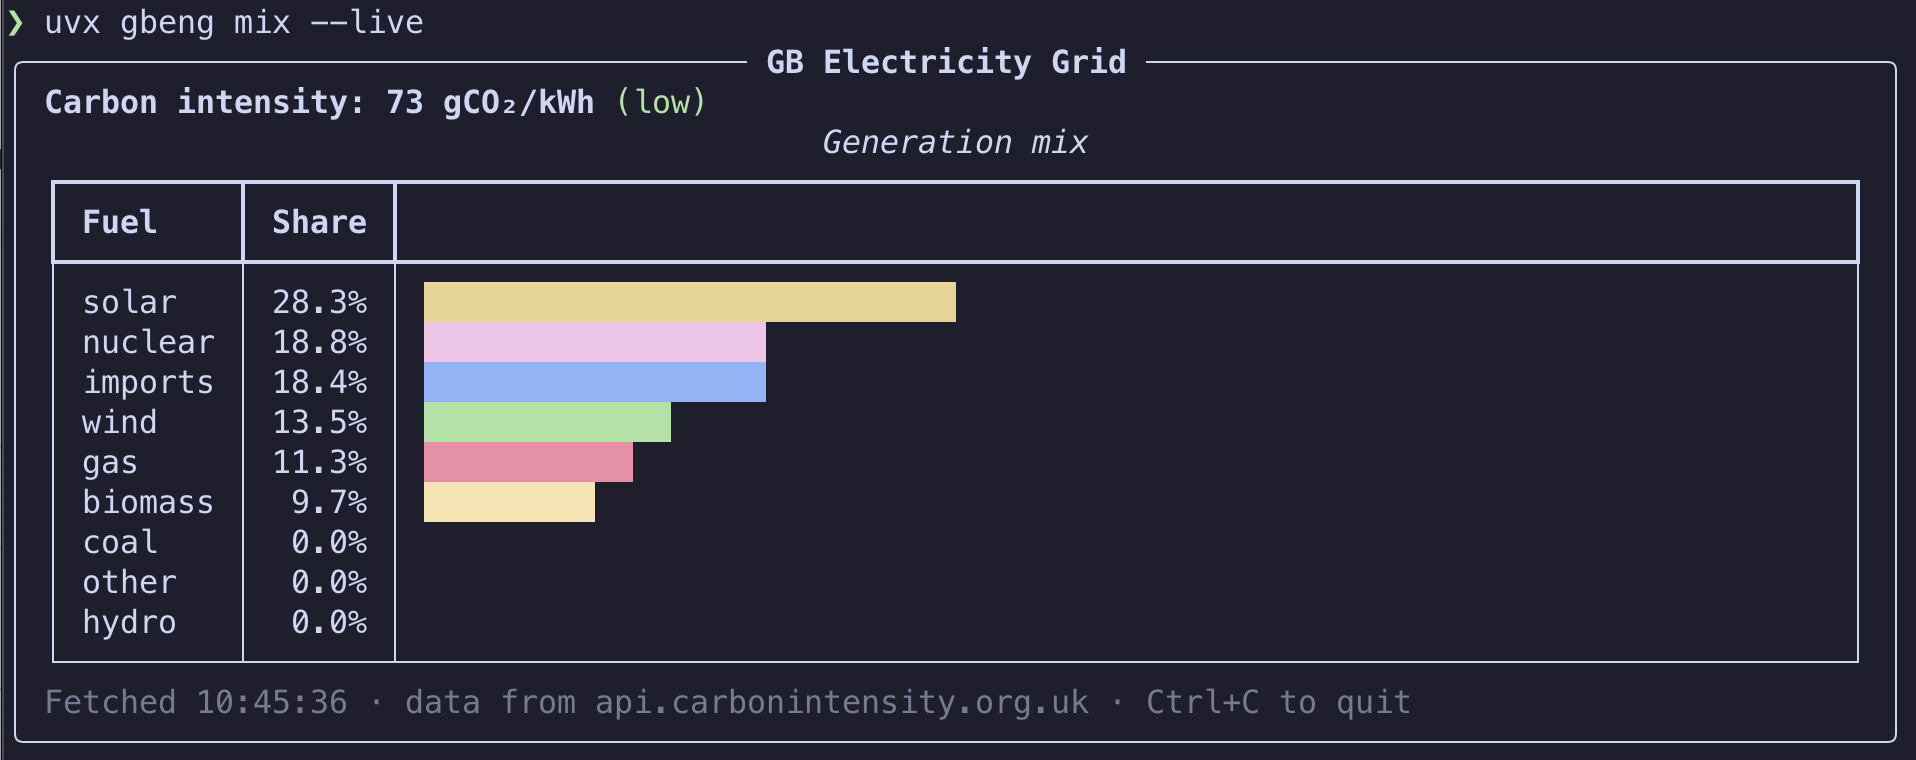
If you want to run it forever and have it update every few minutes than just pass the --live flag:
shelluvx gbeng mix --live
(Note that the data updates every 30 minutes, and the CLI tool will make a request every five minutes).
How does it look?
Where's the project at?
It's on Github at https://github.com/phalt/gb-energy-mix-cli.
The licence is MIT.